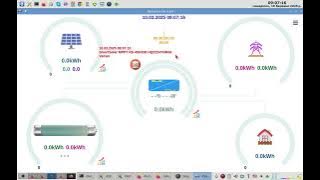
Real time solar station monitoring system
dSolar is a complex of programs and devices for monitoring and managing your solar power plant.
The dSolard server program runs on OS Linux and can be installed on the:
All data, collected by the server, is stored locally on your Linux device. The data is stored once per second.
dSolard can collect information from sensors of any equipment that supports the Modbus data transfer protocol.
The program has a built-in battery charge management algorithm and calculation SOC.
The program has an energy management mechanism "Energy Control" and "WinterESS" and "DAM (Day Ahead Market)".
Allows you to create rules for controlling additional equipment (inverters, relays, ...) based on sensor values combined with logical operations.
Allows you to track critical system states and report them using "Telegram".
The dSolar client program runs on a Linux, Windows or Andorid OS.
The number of devices that can be connected to dSolar is not limited.
Any device that supports command transmission via the modbus protocol can be connected to dSolar.
If your device works using the Modbus-RTU protocol, you can connect it as shown in the diagrams:
If your device works using the Modbus-TCP protocol, you can connect it as shown in the diagrams:

When clicking on the Solar Panel Indicator opens the PV dynamic data window. This window presents the data in section existing equipment (MPPT tracker). Textual, graphical, diagrammatic information is displayed dynamically with a second-by-second change based on the latest sensor values. For graphs, you can specify the visualization of data for the last minute, the last ten minutes, or the last hour.
Clicking on the icon located in the lower right corner of the solar panel indicator opens a window of historical PV data. Histogram of energy and graphs by sensors.
Historical data on equipment sensors is available for any day. Graphs can be scaled to the seconds interval.
When clicking on the Battery Panel Indicator opens the Battery dynamic data window. This window presents the data in section existing equipment (Inverter). Textual, graphical, diagrammatic information is displayed dynamically with a second-by-second change based on the latest sensor values. For graphs, you can specify the visualization of data for the last minute, the last ten minutes, or the last hour.
Clicking on the icon located in the lower right corner of the Battery Panel Indicator opens a window of historical Battery data. Histogram of energy and graphs by sensors.
The energy diagram is supplemented by two graphs:
Historical data on equipment sensors is available for any day. Graphs can be scaled to the seconds interval.
Clicking on the icon located in the lower right corner of the transducer panel indicator opens a window of Energy use data.
Clicking on the icon located in the lower right corner of the transducer panel indicator opens a window of Power use data.
Based on forecasts of solar radiation and real energy generation by your solar station for the previous days, forecasts of solar generation for the next 7 days and daily forecast charts are created.
The program informs about server communication problems with the equipment by showing the server message icon on the dashboard.
Clicking on the icon takes you to the window with list of all existing server messages. Also, this list is available from the main menu.
Viewing the full text of the server message is also available.
The program can send critical messages to the Telegram messenger.
By default, messages are not sent. To send critical messages, it is necessary to activate a specific message and specify the limit parameters of sensor values.
Also, you need to connect the dSolard_bot
ESS is designed to optimally use energy from various sources (PV, Battery, Grid) to ensure minimal energy loss and increase battery life.
ESS manages the moments of connection/disconnection from the grid, battery charging/discharging, and battery charging to the absorption state depending on the set SOC and charging current values.
The current state in which the ESS is located is displayed on the instrument panel, with information about the main parameters of the transition from one state to another.
For correct operation of ESS, the following options must be set in the Deye/Sunsynk inverter settings:
To connect/disconnect from the grid, a controlled external relay must be used.
To control external relays, a visual tool is available to create individual rules for turning relays on and off.
The principle of creating rules is as follows:
There is a corresponding toolkit for checking the rule you created, which allows you to detect syntax errors and execute the rule, resulting in the rule's value: true or false.
This functionality is intended for the user to create requests to any solar equipment that supports the modbus protocol for obtain the sensors values.
According to the documentation for your solar device, you enter the register numbers in which the sensor values are stores.
The program will receive data from these registers, process and store them.
To calculate SOC, you can use the internal algorithm. It uses the values of the discharge current and the battery charge current that has been used since the end of the absorption process.
To be able to calculate SOC, you need to specify the data in the device settings.
The first time, after enabling the internal SOC calculation algorithm, you need to wait for the absorption process to end and switch to the float charge state. At this point, the SOC will be set to 100 percent and the process of calculating it will begin.
The SOC calculation algorithm is based on counting coulombs during battery charging and discharging, taking into account the Peukert coefficient.
If necessary, you can adjust the current that the inverter consumes in idle state by specifying a corrected value in the field "Current calibration". For battery, negative current means discharge, positive current means charge.
To test the algorithm, the current values from the Victron SmartShunt were used. The SOC value calculated in the program was compared with the SOC value calculated by the SmartShunt. After two days of measurements, both graphs were compared. The graphs were identical! No differences! When using the Deye inverter current sensor, the discrepancy was 20 percent compared to the Victron SmartShunt data. However, after adjusting for the inverter's quiescent current consumption, the SOC discrepancy was 1.8 percent.
You can configure the program to only calculate the SOC of your battery. To do this, you need to use the Modbus map functionality, specifying registers to read data from your equipment on battery voltage and current.
The Energy Control function allows you to automatically control the solar power plant by changing the system parameters.
You have more than 30 sensors, virtual sensors, date-time functions, including a solar generation forecast, adapted to the specifics of the placement of your solar panels.
Based on the sensors, you create mathematical expressions, combine them with logical operations into a rule. If the rules are true, the equipment control commands you created are executed.
The controllability of the equipment is practically unlimited. Any equipment that supports the modbus protocol can be controlled.
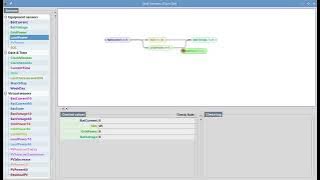
In the screenshot, a command is executed for a Deye single-phase inverter that reduces the battery charging current to 10 amps if the current battery charge state is absorption and the battery charging current specified in the inverter settings is greater than 10 amps.
First of all, you need to create a rule. How to create a rule is described in detail in Relay rule visual tool, and shown in the video Relay control by Deye inverter sensors
Then, you need to add an executor, and describe which device to send the modbus command to change the value of which register.
This functionality allows you to control the equipment according to hourly electricity prices (Day Ahead Market). This allows you to use your solar power plant efficiently to get more financial benefits. You can consume electricity when it is cheap and sell electricity during hours when it is expensive.
With Energy control, you can create rules using additional sensors that describe the state of the "Day Ahead Market".
For Ukraine, current electricity prices are obtained from www.oree.com.ua
On the picture shows a example of a simple rule that enables the sale of electricity at the maximum price:
The rule we created says that:
The dSolar program has a built-in algorithm for determining the optimal hours for buying(battery charging) and selling(battery discharging) with a mechanism for adapting to grid outages.
To use it, you need to configure:
Available statistics on the operation of the power plant in the DAM mode:
As we know, modbus and/or rs485 do not allow several programs or processes or threads to receive data from the Modbus Device at the same time. The Modbus-RTU TCP Server solves this problem.
The Modbus-RTU TCP Server receives packets arriving at the TCP socket and transmits them in the same form (without preprocessing) to the Modbus Device, and receives packets from the Modbus Device and transmits them in the same form to the TCP socket. If packets from several programs/processes/threads arrive at the TCP socket, the packets are queued so that the next packet will be transmitted to the Modbus Device only when the Modbus-RTU TCP server receives a response from the Modbus Device to the previous packet. This allows multiple programs/processes/threads to access the one Modbus Device.
This functionality was tested on the MPPT device EPEVER Tracer AN.
One thread sent four requests every second to obtain information from of eight registers. A total of six threads were launched. There were no packet losses during four hours of operation.
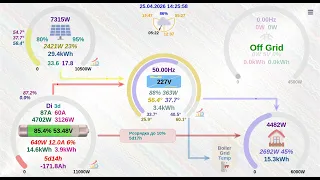
If the indicator is used on the main instrument panel where they are displayed generalized data on all generating equipment. Otherwise, data on specific equipment is displayed.
Indicators of the indicator (from left to right, top to bottom):
If the indicator is used on the main instrument panel, they are displayed generalized data on batteries. Otherwise, data on specific equipment is displayed.
Indicators of the indicator (from left to right, top to bottom):
If the indicator is used on the main instrument panel, they are displayed generalized load data. Otherwise, data on specific equipment is displayed.
Indicators of the indicator (from left to right, top to bottom):
If the indicator is used on the main instrument panel, they are displayed data over the public grid.
Indicators of the indicator (from left to right, top to bottom):
Indicator is used on the main instrument panel where they are displayed data from the sensors of the transducer.
Temperature indicator sliders have dynamic initial and final temperature values, which are, respectively, the minimum and the maximum temperature value for the current day.
Indicators of the indicator (from left to right, top to bottom):
The real-time solar monitoring system is built on the basis of client-server technology. dSolard server program (or dSolarLite all in one program) operates on a Raspbery or Linux x86_64 microcomputer (Android and Linux x86_64 for dSolarLite) and communicates with the equipment by receiving and storing sensor data every seconds.
The dSolar client program is designed for data processing and visualization, it runs on Windows and Android. Number of dSolar client programs that can be connected to one server dSolard or dSolarLite is not limited. All of them will receive data from the server in asynchronous mode. That is, immediately as soon as the data arrives from the equipment sensors.
The dSolarLite program is both a server and a client (all in one).
To receive monitoring data via the Internet, you need to mapped port 7493 through your router to the dSolard or dSolarLite server.
| Step by step actions when using: | |
| dSolard | dSolarLite |
| 1. Install the dSolard server program on mini-PC | 1. Install the dSolarLite program on Android or mini-PC |
| 2. Run the dSolard server program in configure mode as: $ ./dSolard configure |
2. Run the dSolarLite program |
| 3. Install the dSolar client program to any device in the local network | 3. Add equipment using the dSolarLite program interface |
| 4. Connect via local network to the dSolard server from the dSolar client | 4. Restart the dSolarLite program |
| 5. Add equipment using the dSolar program interface | |
| 6. Restart the dSolard server | |
| 7. In addition, you can use the dSolar client program to communicate with the dSolard(dSolarLite) server both from the local network and from the Internet. | |
| Differences when using dSolard or dSolarLite programs for data storage | ||
| Property | dSolard server | dSolarLite |
| 1. Data storage period with a second interval | 40 days | 24 hours |
| 2. Data storage period with a 10 second interval | forever | forever |
| 3. Connect to equipment | rs485 or wifi | rs485 or wifi for Linux; wifi for Android |
The dSolard server or dSolarLite processes data from the following equipment:
The equipment is connected to the Raspberry or MiniPC using specialized cables with a built-in inverter interfaces rs485 to USB or via wifi connecting to the logger.
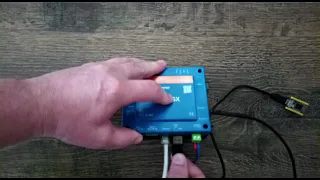
To connect the DEYE inverter to the computer with dSolard server, I use the FTDI FT232RL USB TO RJ45 adapter.


The equipment is connected to the Raspberry or MiniPC using specialized cables with a built-in inverter interfaces rs485 to USB.
All Victron ve.can MPPT chargers can be connected to the dSolar via usb to can adapter. I use the CANable USB to CAN Canbus adapter. Please, choose Isolated version this adapter, she supports Linux SocketCAN interface.
The SmartShunt is connected to the Raspberry or MiniPC using VE.Direct to USB cable.
For the victron equipment, dSolar can be installed on the Linux mini PC or Venus OS.
The installation steps on PC are described in dSolard server installation
The dSolar server archive contains the socket CAN interface autoconfiguration file (80-socketcan.rules). Copy it to the appropriate directory /etc.
I use the first channel of the relay block to dump the excess energy to heat the water. And uses the second channel of relay block for disconnects the grid when it is not needed.
Consider the rules for turning on and off the water heating relay:
Water heating is turned on if:
Water heating is turned off if:
Manual relay control is also possible:
The current state of the relay is displayed on the dashboard:
The list of relay events for the last 7 days:
I am using dtwonder four channel relay block.
Bought here: dtwonder relay block

To make the relay work with the dSolar server, you need to perform the following settings:
The dSolard, dSolarLite and dSolar programs do not require any additional configuration operating systems on which they function.
Step-by-step instruction for install dSolard on Raspberry PI or Debian:
Step-by-step instruction for upgrade dSolard on Raspberry PI or Debian:
Reindex and vacuum database:
First of all, you need to specify the IP-address or dns-name of the dSolard(dSolarLite) server in the dSolar program settings.
Use all other settings according to your own preferences.
To receive monitoring data via the Internet, you need to mapped port 7493 through your router to the dSolard or dSolarLite server.
Here is an example of a router configuration for mapping a dSolard or dSolarLite server port:
After starting the client program for the first time, you must specify the IP address of the dSolard server in the settings:
The equipment configuration is allowed only when the dSolard server is running in configuration mode:
For dSolarLite the equipment configuration is allowed only from local device on which the dSolarLite program is running.
And add your equipment:
When changing equipment communication data ("Port" or "MODBUS Address") or adding new equipment - it is necessary restart the dSolard server or dSolarLite program.
After completing the equipment configuration, it is necessary to start dSolard server in normal mode (without attribute "configure"):
For the dSolard server I have successfully used raspberry, but recently, there has been a significant shortage of Raspberry computers. For my own use, I switched to a mini-PC.
Bought here: Beelink Mini S
I am satisfied with the computer.

All programs presented on this site do not collect, transmit or use any personal information in any way.
| Free |
|
Without Chart of dynamic data
Without Chart of historical data
Without Energy use
Without Power use
Without Solar generation forecast
Without Messages in Telegram
Without Relay Rule
Without ESS
Without Energy control
Without Day Ahead Market
|
|
$0 (for home use only)
|
| Partial |
|
With Energy use
With Power use
With Messages in Telegram
Without Relay Rule
Without ESS
Without Energy control
Without Day Ahead Market
|
|
once $49 (for home use only)
|
| Middle |
|
With Energy use
With Power use
With Messages in Telegram
With Relay Rule
With ESS
With Energy control
Without Day Ahead Market
|
|
once $89 (for home use only)
|
| Full |
|
With Energy use
With Power use
With Messages in Telegram
With Relay Rule
With ESS
With Energy control
With Day Ahead Market
|
|
For Home Use:
One-time $0.49 for every 1 kWh of battery capacity + $0.1 per month for every 1 kWh of battery capacity
For Businesses:
One-time $0.79 for every 1 kWh of battery capacity + $0.39 per month for every 1 kWh of battery capacity |


